- Éducation
- Stratégies de trading
- Stratégie de Trading V-Bounce Volume Spike
V-Bounce Volume Spike Trading Strategy
Since the level of profit earned per trade can be small, many traders seek out more liquid markets to increase the frequency of their trades. A popular 60-second option trading strategy involves detecting the moment a price clearly rebounds, against either an identifiable resistance or support level.
Role of support and resistance
Support and resistance (S&R) are key factors in trading with EO Broker.

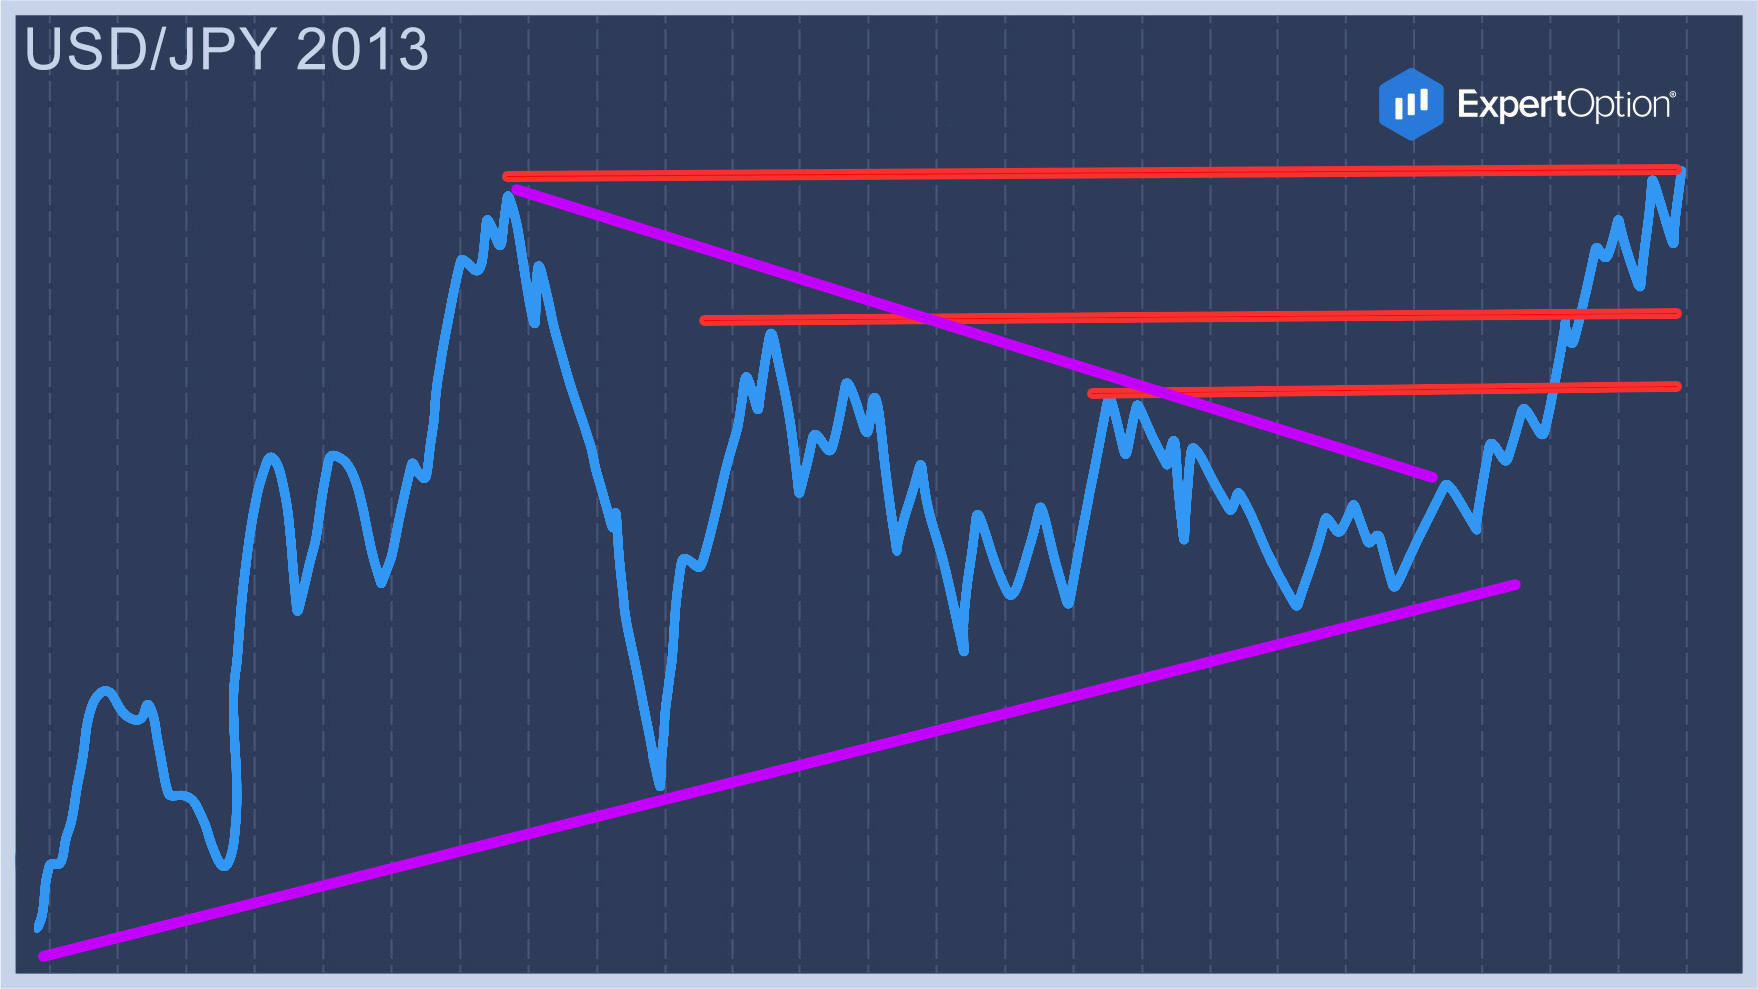
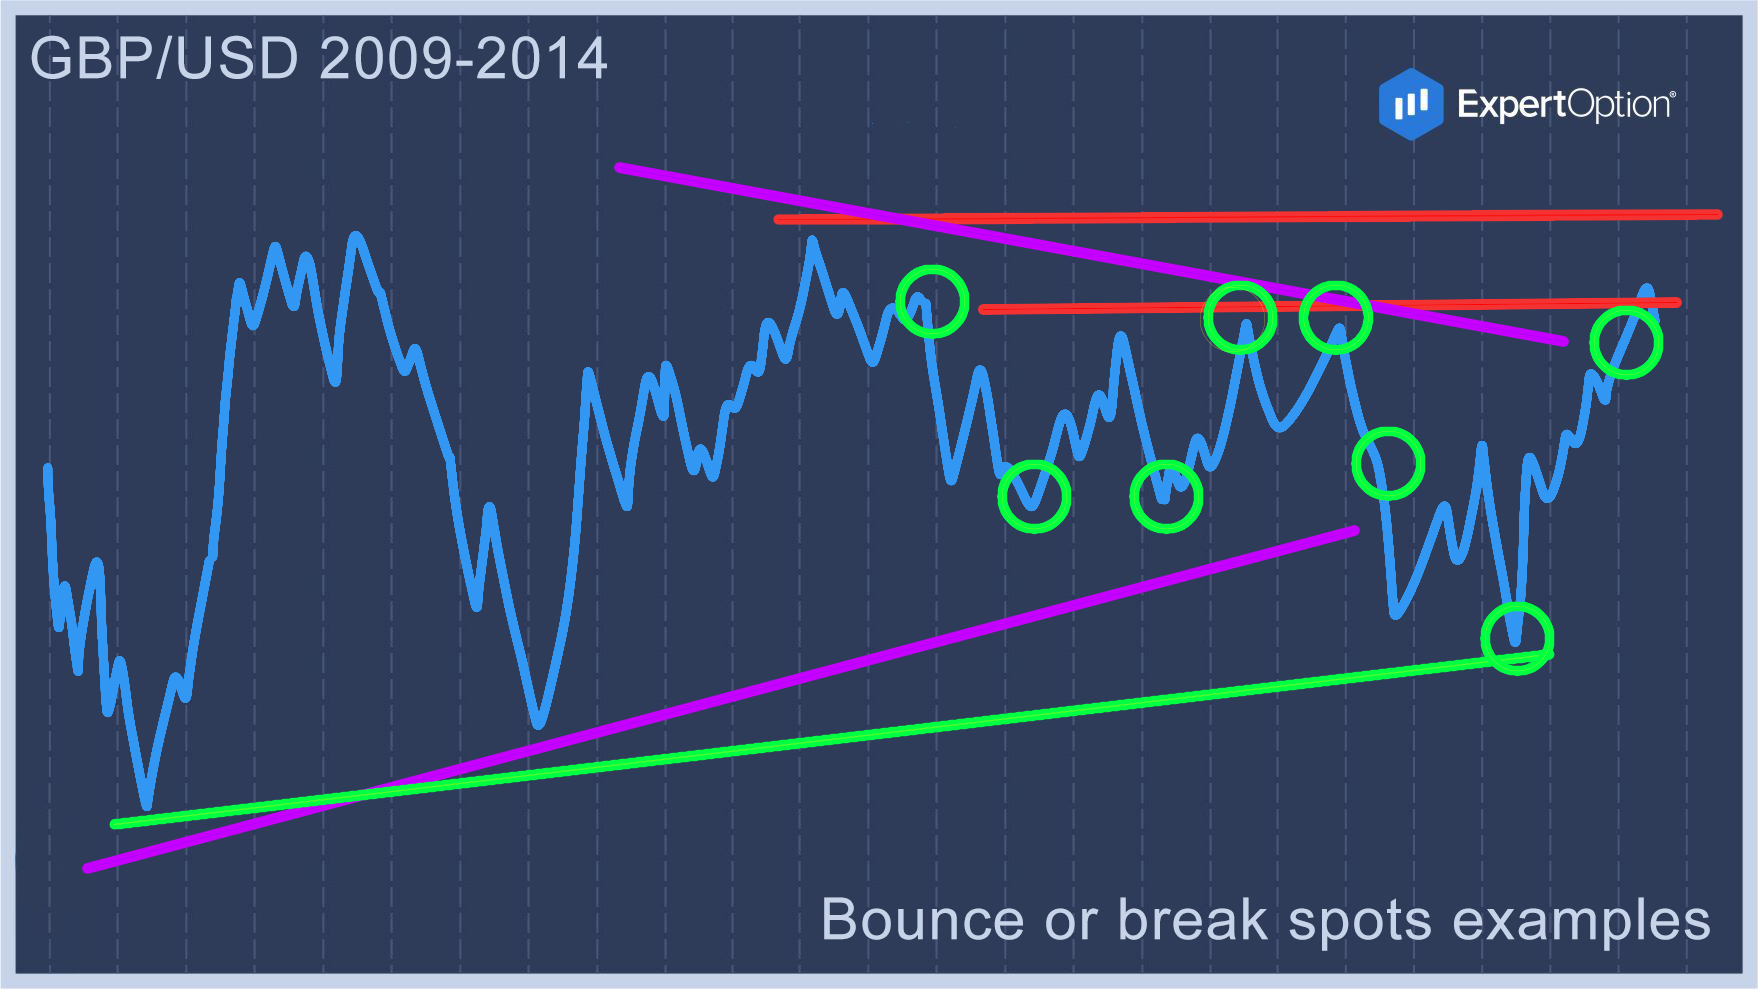
Once a price reaches pre-determined support or resistance levels, traders can mark the zone as a “bounce or break spot”.
There are various ways for EO Broker traders to identify the support and resistance zone (testing the usefulness of their S&R identification is important).
Many elements can be considered as support and resistance. Here's a list with a few examples:
- Tops and bottoms
- Trend lines
- Trend channels
- Fibonacci retracements
- Fibonacci targets and extensions
- Chart patterns
The support and resistance indicators can also be used in various ways:
- As a target, thereby placing an order to take profit at that level.
- As a filter, thereby purposely not taking a trade setup due to S&R.
- As a trigger and/or entry, thereby taking a potential trade upon the break or bounce.
Break or bounce spot
This article is geared towards explaining how an EO Broker trader can trade/approach a bounce or break spot.

Once an EO Broker trader has identified this spot, they now have a “line in the sand”. The EO Broker trader has a clear level that they mark for themselves as crucial.
Why is this important?
- The EO Broker trader needs to mark certain levels, areas, zones, and price zones as important in advance so that there is a clear moment when a decision is/has to be made and all other price movement is filtered out (ignored).
- If an EO Broker trader doesn't set up some kind of filter, the process of trading would become very problematic as all new data would be reviewed with the same importance (creating fear and greed).
Once a break or bounce spot has been identified (according to the trader’s tools), the trader can wait for the price to reach that particular zone, and wait for the price to either break or bounce off that particular support or resistance level.
- A break is when the price pushes through the support and resistance. It's called a breakout trade, and the price then has enough momentum to break through that zone.
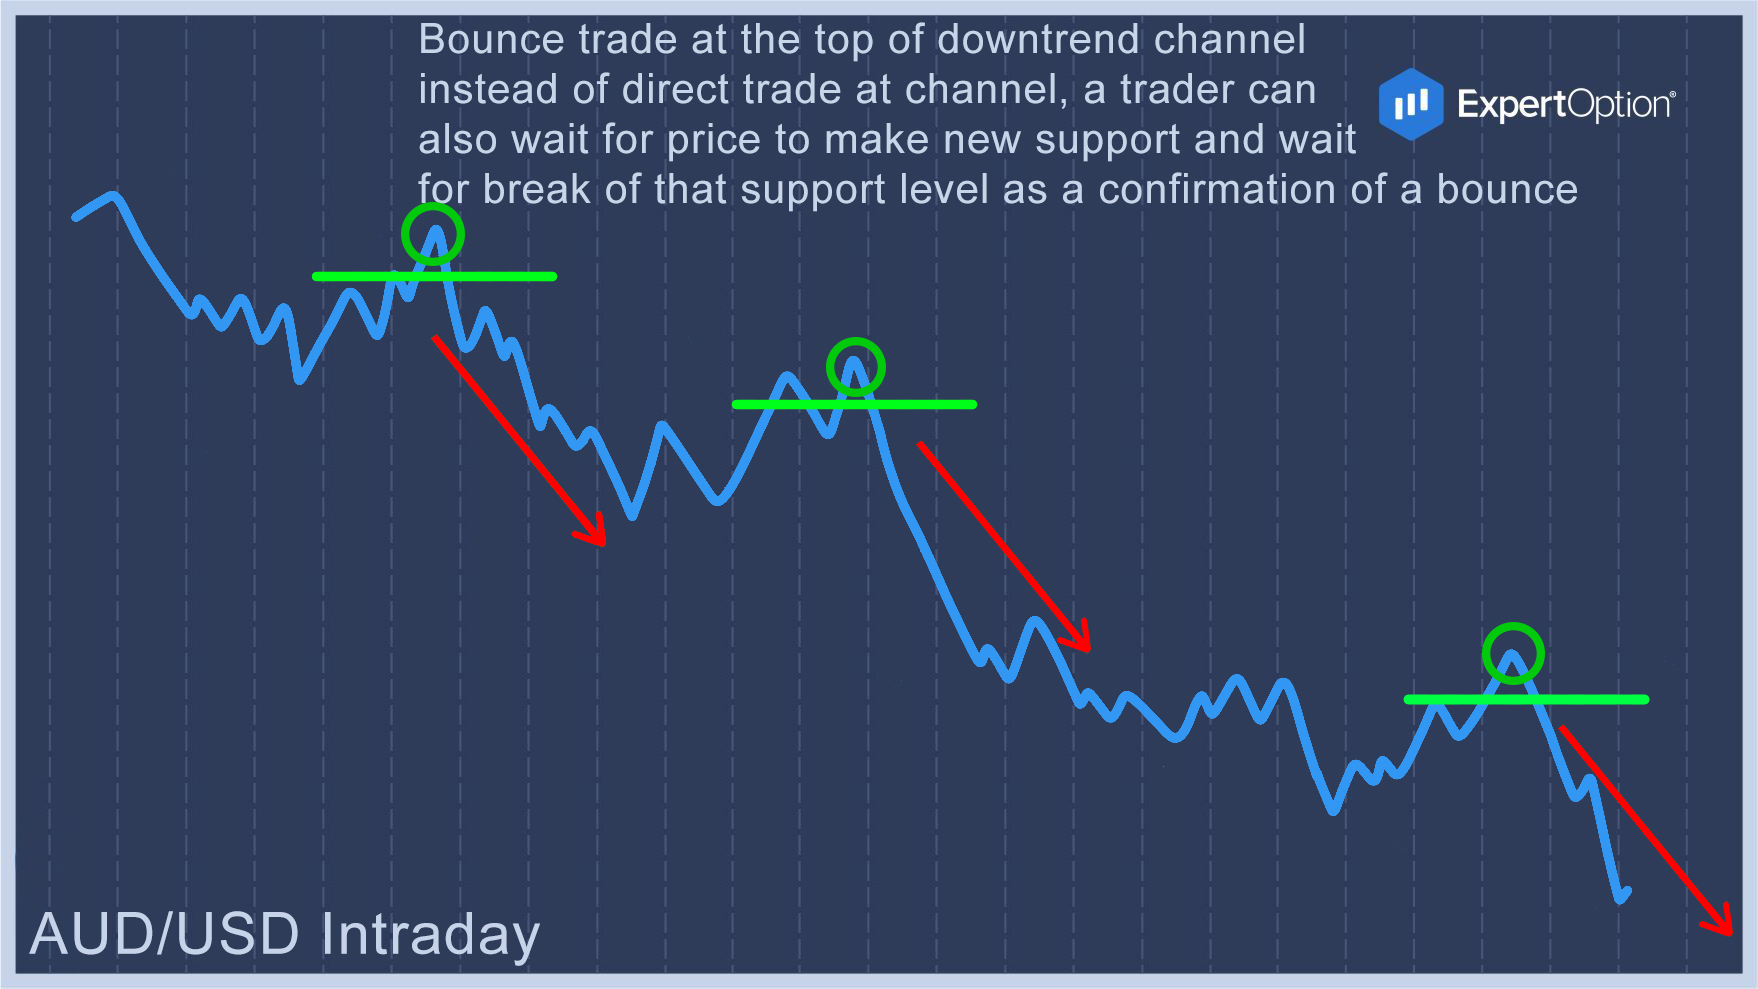
- A bounce is when the price doesn't push through the support and resistance. In this case, the price doesn't have sufficient momentum to break through, and the price ultimately “respects” the zone.
On the EO Broker platform, we are on the lookout for breakout trade setups (strikes) and the first pullback after the breakout (boomerang) in the options market. This means:
- Strike = break trade
- Boomerang = bounce trade
Trading bounces
A bounce scenario could mean that the price is either making a small retracement, a big retracement, or a reversal. In the case of a small retracement, the price might still break through the support and resistance a little way later. Big tops and bottoms and Fibonacci levels are usually not broken without at least some “respect” for these levels (price won't go through the level without stopping).

A bounce trade can be entered via various methods.
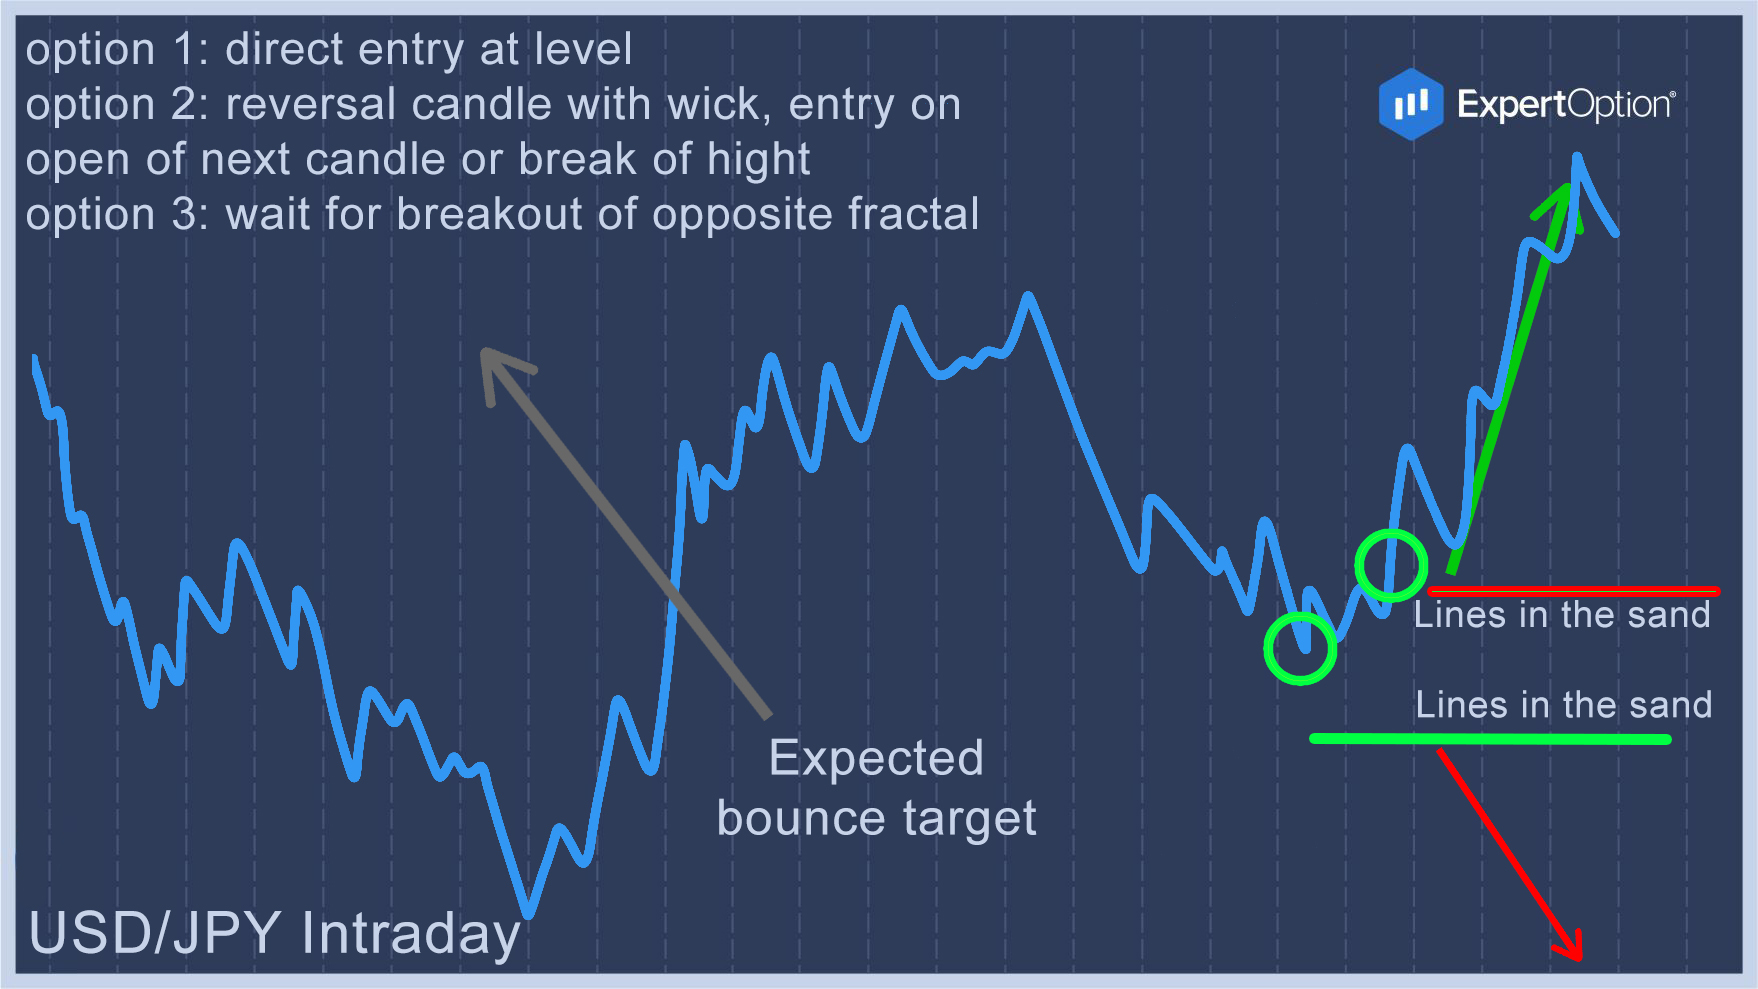
1. Direct. A trader attempts to trade directly at the expected support or resistance zone.
Example: Let’s say that you are looking at a particular Fibonacci level or top as a resistance. Having an entry order directly at that level is one way of trading an expected bounce at that S&R.
Advantage: Earliest entry.
Risk: Price continuing without stopping at a level.
Problem: Stop-loss placement as the price can overextend on smaller time frames through the S&R area — even if it’s slight.
2. Confirmation of bounce. A trader waits for a confirmation of the price to stop at the expected support or resistance zone.
Example: Let’s say that you are looking at a particular Fibonacci level or top as a resistance. Waiting for a candlestick pattern at the expected S&R is a confirmation method.
Advantage: Price is stopping at the expected level and a clear stop loss level is known.
Risk: Price could move away from S&R (substantially) before confirmation takes place.
Problem: This could be a late entry, especially if the trade is taken against a prevailing trend.
3. Breakout after bounce. One of the differences is the usage of fractals (we'll explain more in the section below). Also, read about scaling in and scaling out on the EO Broker platform.
Bounce using fractals
Another way to trade the bounce is by using fractals. Here's how the process works:
- An EO Broker trader can anticipate a certain S&R to be important.
- Wait for the price to stop or move to that level and make a fractal.
- Wait for the price to move away from that S&R.
- Wait for the price to form a fractal on the opposite side.
- Wait for a break of that opposite fractal.
What does this mean?

Essentially, by allowing a price stop, reverse, stop, and reverse, the EO Broker trader now has two lines in the sand. One is at the expected S&R, the other is on the opposite side. A break above or below either of these 2 levels then constitutes the likely winner.
For example: There is an uptrend on the 4-hour chart. The price stops at the S&R (for instance, Fibonacci retracement). The price then moves down 40 pips, even further away from it, and forms a fractal on top of the price on the 4-hour chart. The price then bounces back up again with the trend but fails to break out above the resistance fractal. At this point, there are 2 fractals. A break above the fractal constitutes a break-out. A break below the fractal means a “bounce break-out” (a breakout in the opposite direction after a bounce).
Using this method, it's translated as a bounce trade into a breakout. EO Broker traders can also use the BPC method: break, pullback, and continuation. Also, depending on the time frame, it's a good idea to go a few pips above or below a fractal (6-20).
It's important to realize that the odds of success are greatest when trading the bounce:
- during a very strong S&R and a trader is attempting to catch a strong reversal;
- during a trend and a trader is attempting to identify the S&R for trend continuation.
This is an EO Broker concept or method, not a system, which means there are no particular statistics. It would be the same as asking how successful are break-outs or trading with the trend. The sample size is huge and depends on too many variables. But the idea could be a building block for a detailed trading strategy. This EO Broker trading concept is a discretionary method of trading and must be used along with other tools and analysis, specifically multiple time frame analysis.